Study of Classic Ketogenic Diet vs. Modified Atkins Diet in Treatment of Refractory Epilepsy in Children with their Effects on Growth and Developmental Milestones
Deshpande VP1*, Prabhu PS2, Udani VP3 and Agarkhedkar SR1
1Department of Pediatrics, Dr. D.Y. Patil Medical College, Pune, India 2Department of Pediatrics, Hinduja Hospital, Mumbai, India 3Department of Pediatric Neurology, Hinduja Hospital, Mumbai, India
Published Date: 2023-09-11Deshpande VP1*, Prabhu PS2, Udani VP3 and Agarkhedkar SR1
1Department of Pediatrics, Dr. D.Y. Patil Medical College, Pune, India
2Department of Pediatrics, Hinduja Hospital, Mumbai, India
3Department of Pediatric Neurology, Hinduja Hospital, Mumbai, India
- *Corresponding Author:
- Deshpande VP
Department of Pediatrics,
Dr. D.Y. Patil Medical College, Pune,
India,
E-mail: vp_deshpande@yahoo.com
Received date: August 09, 2023, Manuscript No. IPCDD-23-17680; Editor assigned date: August 14, 2023, PreQC No. IPCDD-23-17680 (PQ); Reviewed date: August 28, 2023, QC No. IPCDD-23-17680; Revised date: September 04, 2023, Manuscript No. IPCDD-23-17680 (R); Published date: September 11, 2023, DOI: 10.35841/2471-1786.9.4.79
Citation: Deshpande VP, Prabhu PS, Udani VP, Agarkhedkar SR (2023) Study of Classic Ketogenic Diet vs. Modified Atkins Diet in Treatment of Refractory Epilepsy in Children with their Effects on Growth and Developmental Milestones. J Child Dev Disord Vol.9 No. 4: 79.
Abstract
Introduction: Ketogenic Diet is well known for control of refractory epilepsy. We wanted to study effect of the two types of diet Classical Ketogenic Diet and Modified Atkins Diet with Indian foods to children of refractory epilepsy.
Aim: To determine effects of two types of Ketogenic Diet on development and IQ.
Material and methods: Ethics Committee approval was taken, 65 children of refractory epilepsy of 6 months to 12 years age from 2 tertiary care teaching institutes of Pune and Mumbai, were selected and randomly allocated to one of the two types of diets. Developmental milestones including height and weight and IQ was taken pre and post diet.
Observations: There was improvement in developmental milestones and the IQ in both the types of diets with significant increase in Classic Ketogenic Diet than Modified Atkins Diet.
Conclusion: Classic Ketogenic Diet has significant better effectiveness than MAD as development and IQ are concerned.
Abbreviations: KD: Classic Ketogenc Diet; MAD: Modified Atkins Diet.
Keywords
Ketogenic diet; Refractory epilepsy; Ketogenic diet in children and IQ
Introduction
Epilepsy is the enduring predisposition to generate seizures and by neurobiological, cognitive, psychological and social consequences of this condition. The clinical diagnosis of epilepsy usually requires occurrence of at least one unprovoked epileptic seizure with either a second such seizure or EEG and clinical information to demonstrate enduring predisposition to develop recurrences [1]. Drug resistant or refractory or uncontrolled epilepsy is defined as those who did not respond to the proper trial of 2 antiepileptic medication, either alone or in combination [2]. Incidence of epilepsy in children varies from 50-150/100000 person years [3]. Pharmaco-resistance in epileptic seizure could arise from a range of conditions, such as non-compliance, nonepileptic seizures, inappropriate use of medication and wrong diagnosis of the type of seizure and lifestyle issues [2].
A dietary approach to the treatment of epilepsy was available in 5th Century BC, when Hippocrates described a man whose seizures were cured by abstaining from all food and drink [4]. Ketogenic Diet is being used from biblical era to halt epilepsy [5]. ‘Ketogenic Diet’ the term was coined by Wilder as described by Wheless, et al., in his article in 2004 [6]. Efficacy of Ketogenic Diet in uncontrolled epilepsy has been confirmed in various studies from 1921 onwards by Gayle as mentioned by Wheless, et al., [7].
There are many studies been carried out mainly from the western countries to study effects of Ketogenic Diet? But hardly any studies from India. Therefore we wished to explore effects of Ketogenic Diet induced mainly by Indian food items and their effects mainly on growth and development by conducting a RCT.
Aim
To determine effects of two types of Ketogenic Diet on development and IQ.
Materials and Methods
After Ethical Committee’s permission, 65 children of refractory epilepsy of 6 months to 12 years duration from 2 tertiary care teaching institutes of Pune and Mumbai, India, were selected and randomly allocated to one of the two types of diets: Classic Ketogenic Diet and Modified Atkins Diet and followed over a period of 6 months. Pre-diet assessment of height weight, head circumference and development were noted. In age >/=6 years IQ assessment done with the help of VSMS, Kamat-Binett, or MISIC. Every child was followed monthly over a period of 6 months. Developmental mile stones were noted. For children >6 years age, IQ was advised after 6 months of therapy. 8 patients from each group failed to follow up till 6 months, therefore were dropped. Only 11 children of >6years age could do IQ after 6 months.
Observations
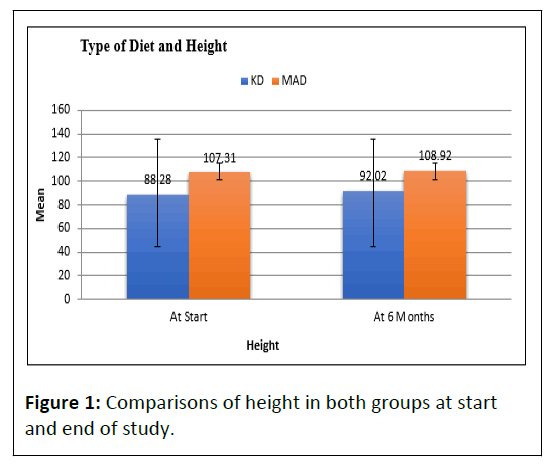
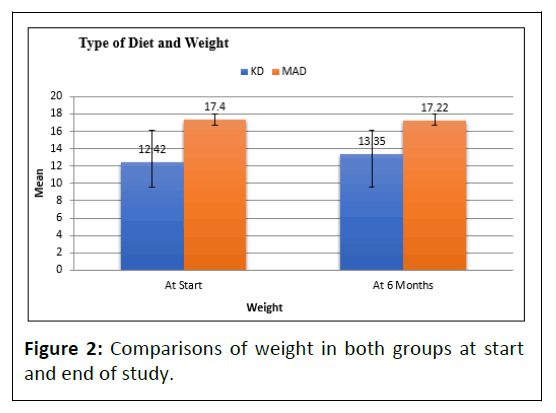
Height and weight were compared only in those patients who completed six months of KD (n=36) or MAD (n=13) diet. As displayed in Table 1 and Figure’s 1 and 2, at start of study mean height and weight was significantly lower among patients who were given Ketogenic Diet (88.28 cm ± 17.42 cm and 12.42+5.12 kg respectively) comparing to those patients who were given Modified Atkins Diet (107.31 cm ± 17.66 cm and 17.40 ± 5.52 kg respectively) (p<0.05). At 6 months follow up mean height and weight remained significantly lower among patients who were given Ketogenic Diet (92.02 cm ± 15.56 cm and 13.35 ± 4.08 kg respectively) comparing to those patients who were given modified Atkins Diet (108.92 ± 16.8 cm and 17.22 ± 6.38 kg respectively) (p<0.05). While mean height had significantly increased in all patients from start of study to 6 months follow up but mean weight was significantly reduced from start of study to 6 months follow up in MAD group but increased in KD group.
| KD (n=36) | MAD (n=12) | Total (n=48) | P-Value | ||
|---|---|---|---|---|---|
| Height | At the start | 88.28 ± 17.42 | 107.31 ± 17.66 | 93.33 ± 19.27 | t=3.4, S,P=0.002 |
| At 6 months | 92.02 ± 15.56 | 108.92 ± 16.83 | 96.51 ± 17.43 | t=3.3, S,P=0.002 | |
| P-value | t=7.1, S,P<0.001 | t=5.1, S, P<0.001 | t=7.6, S, S,P<0.001 | ||
| Weight | At the start | 12.42 ± 5.12 | 17.40 ± 5.52 | 13.74 ± 5.62 | t=3.0, S,P=0.005 |
| At 6 months | 13.35 ± 4.08 | 17.22 ± 6.38 | 14.37 ± 5.03 | t=2.2, S,P=0.02 | |
| P-value | t=2.2, S,P=0.033 | t=0.3, NS,P=0.80 | t=1.7, NS,P=0.08 | ||
| Note: Statistical tests applied: 1.Student's unpaired t test 2.Student's paired t test. | |||||
Table 1: Comparison of height and weight in both groups at start and end of study.
• Significant difference in mean height and weight between 2 groups at the start and at 6 months between two groups.
• Significant difference in mean height and weight between 2 time points for KD and height for MAD group at the start and at 6 months (except in mean weight for MAD and total).
Diet and developmental milestones
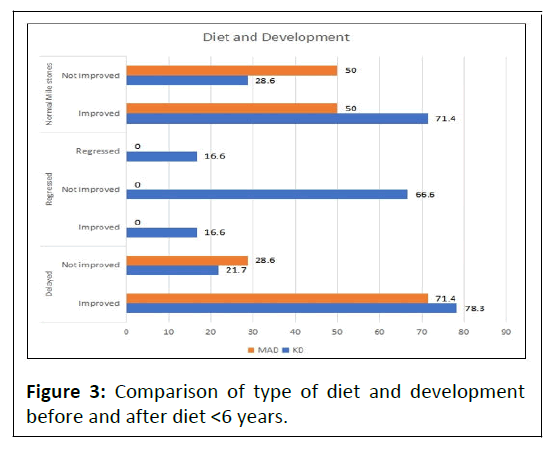
Among patients who were given KD, 70.5% had delayed development of which 78.3% patients had improvement in development, while among MAD group, 61.1% patients had delayed development of which 71.4% had improvement. 6 patients of KD group (13.6%) had regression in milestones initially of which one had showed improvement (16.6%) after diet whereas 1 continued to regress while other 4 were static. 15.9% of KD group and 38.1% of MAD group had normal milestones initially, of which 71.4% of KD and 50% of MAD groups had further achievements in milestones normally whereas rest of them got delayed milestones as shown in Table 2. However all these were not significantly associated.
| Development | Pre diet | Total | Post diet | Total (%) | P-Value | ||
|---|---|---|---|---|---|---|---|
| KD (%) | MAD (%) | KD (%) | MAD (%) | ||||
| Delayed | 31 (70.5%) | 13 (61.1%) | 44 (67.7%) | Improved 18 out of 23 (78.3) | Improved 5 out of 7 (71.4) | Improved 23 out of 30 (76.7) | 0.708 |
| Not improved 5 out of 23(21.7) | Not improved 2 out of 7 (28.6) | Not Improved 7 out of 30 (23.3) | |||||
| NA 8 | NA 6 | NA 14 | |||||
| Regressed | 6 (13.6%) | 0 | 6 (9.2%) | Improved 1 out of 6 (16.6) | Improved 0 | Improved 1 out of 6 (16.6) | NA |
| Not improved 4 out of 6 (66.6) | Not improved 0 | Not improved 4 out of 6 (66.6) | |||||
| Regressed 1 out of 6 (16.6) | Regressed 0 | Regressed 1 out of 6 (16.6) | |||||
| Normal mile stones | 7 (15.9%) | 8 (38.1%) | 15 (23.1%) | Improved 5 out of 7 (71.4) | Improved 3 out of 6 (50) | Improved 8 out of 13 (61.5) | 0.59 |
| Not improved 2 out of 7 (28.6) | Not improved 3 out of 6 (50) | Not improved 5 out of 13 (38.5) | |||||
| NA 0 | NA 2 | NA 2 | |||||
| NA | 0 | 0 | 0 | 8 (18.2) | 8 (38.1) | 16 out of 65 (24.6) | |
| Total | 44 (100%) | 21 (100%) | 65 (100%) | 65 (100) | |||
| Note: Statistical test: Fisher exact probability test: No significant difference in all above parameters. | |||||||
Table 2: Distribution of patients based on type of diet and development.
More than 6 years old patients who were given diet, all 4 patients from KD group had Intelligent Quotient (IQ) 35–50 (moderate/trainable). However, more than 6 year old patients who were given Modified Atkins Diet (n=7), 28.5% patients had IQ 20–35 (severe), 42.8% had 35–50 (moderate/trainable), 28.5% had IQ 50–70 (mild/educable) and there were no patients who had borderline IQ (70–90) or profound (<20) (Figure 3).
Distribution of patients based on type of diet and intelligent quotient (more than 6 years)
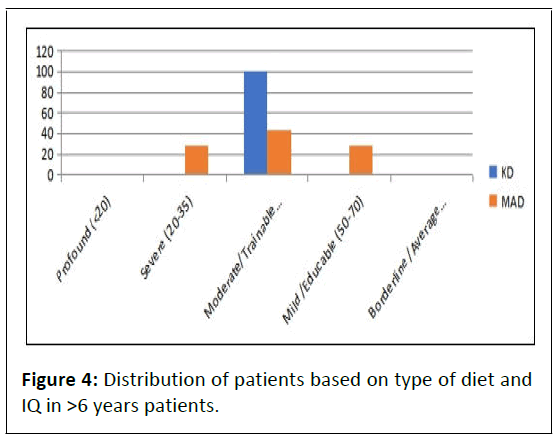
More than 6 years old patients who were given diet (n=11), all 4 patients from KD group had Intelligent Quotient (IQ) 35–50 (moderate/trainable). However, more than 6 year old patients who were given Modified Atkins Diet (n=7), 28.5% patients had IQ 20–35 (severe), 42.8% had 35–50 (moderate/trainable), 28.5% had IQ 50–70 (mild/educable) and there were no patients who had borderline IQ (70–90) or profound (<20) (Table 3 and Figure 4).
| Development | Type of diet used | Total (%) | |
|---|---|---|---|
| KD (%) | MAD (%) | ||
| Profound (<20) | 0 | 0 | 0 |
| Severe (20-35) | 0 | 2 (28.5) | 2 (18.2) |
| Moderate/Trainable (35-50) | 4 (100) | 3 (42.8) | 7 (63.6) |
| Mild/Educable (50-70) | 0 | 2 (28.5) | 2 (18.2) |
| Borderline/Average (70-90) | 0 | 0 | 0 |
| Total | 4 (100) | 7 (100) | 11 (100) |
Table 3: Distribution of patients based on type of diet and intelligent quotient >6 years.
Effect of diet on IQ
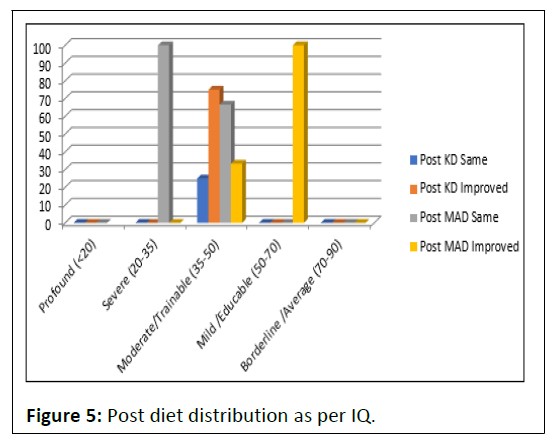
For this study explanation about effect of diet on IQ (Table 4 and Figure 5).
| IQ | Type of diet used | P value | Total | |||
|---|---|---|---|---|---|---|
| KD (%) | Post KD (%) | MAD (%) | Post MAD (%) | |||
| Profound (<20) | 0 | 0 | 0 | 0 | ||
| Severe (20-35) | 0 | 0 | 2 out of 7 (28.5) | Same-1 (100) NA-1 (0) | 2 Same-1 (100) NA-1 (0) | |
| Moderate/Trainable (35-50) | 4 (100) | Same-1 out of 4 (25%) improved-3 (75) | 3 out of 7 (42.8) | Same-2 (66.6) improved-1 (33.3) | 0.49 | 7 Same-3 (42.8) Improved-4(57.1) |
| Mild/Educable (50-70) | 0 | 0 | 2 out of 7 (28.5) | Improved-01 (100) NA-1 (0) | 2 Improved-1 (100) NA-1 (0) | |
| Borderline/Average (70-90) | 0 | 0 | 0 | 0 | ||
| Total | 4 (100) | 7 (100) | 11 (16.9) out of 65 | |||
Table 4: Cross tabulation of patients based on type of diet and intelligent quotient >6 years.
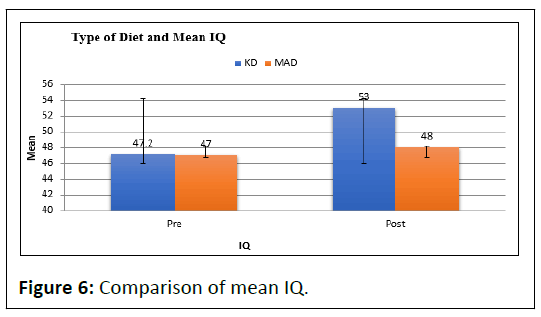
Post diet, 75% of KD patients had improvement in IQ whereas only 33.3% had improvement in IQ of MAD group in moderate IQ group and 100% in mild and 0% in severe group but association was not significant for moderate group. There were no patients in profound and borderline category in either diet group whereas for mild and severe category there were no patients in KD group to compare with MAD group. Though the association in the moderate IQ group was not significant, when mean IQ was compared, KD group had significantly increased IQ pre and post therapy (Table 5 and Figure 6).
| Variable | KD (n=5) | MAD (n=5) | t test value, Significance & P value |
|---|---|---|---|
| Pre | 47.20 ± 10.80 | 47.00 ± 14.41 | t=0.1,NS,P=0.9 |
| Post | 53.00 ± 10.37 | 48.00 ± 16.43 | t=0.6,NS,P=0.6 |
| Change (Post-Pre) | 5.80 ± 2.39 | 1.00 ± 2.24 | t=3.3, S,P=0.01 |
| Note: Statistical test: Student's unpaired t test: Conclusions: | |||
Table 5: Cross tabulation of IQ: Comparison of mean IQ between KD and MAD groups; Data: Mean ± SD.
• No significant difference in mean IQ at Pre and Post time points between 2 groups.
• Significant difference in mean change (Post-Pre) between 2 groups.
Interpretation: KD group had significantly higher gain in IQ values than MAD group.
Discussion
Comparison of height and weight in both groups at start and end of study
Height and weight were compared only in those patients who completed six months of diet. At start of study mean height and weight was significantly lower among patients who were given Ketogenic Diet (88.28 ± 17.42 cm and 12.42+5.12 kg respectively) comparing to those patients who were given Modified Atkins Diet (107.31 ± 17.66 cm and 17.40 ± 5.52 kg respectively) (p<0.05). At 6 months follow up mean height and weight remained significantly lower among patients who were given Ketogenic Diet (92.02 ± 15.56 cm and 13.35 ± 4.08 kg respectively) comparing to those patients who were given Modified Atkins Diet (108.92 ± 16.8 cm and 17.22 ± 6.38 kg respectively) (p>0.05). While mean height had significantly increased in all patients from start of study to 6 months follow up but mean weight was non-significantly reduced from start of study to 6 months follow up in MAD group but significantly increased in KD group.
After prolonged use of KD, significant decrease in weight was observed in children with refractory epilepsy [8]. A study conducted by “Kossoff, et al., [9] had found significant constipation in four children and weight loss in six children. A study by Metha, et al., [10] had also recorded weight loss in 16.6% patients after starting MAD. The main adverse effects of Ketogenic Diet at the initial phase were dehydration, anorexia, hypoglycemia, nausea and vomiting and weight loss, while at later phase, the diet might lead to gastrointestinal symptoms (12%–50%) as vomiting, diarrhea, constipation and abdominal pain, metabolic disorders, decreased growth rate and cardiac complications as QT prolongation and dilated cardiomyopathy” [11].
Development assessment (<6 years) and intelligent quotient in (>6 years) old patients
In this study at the diet initiation, the developmental delay found in 70.5% KD group and 61.1% MAD group patients. Of which 78.3% improved developmentally on KD Diet vs. 71.4% on MAD diet. 13.6% patients had regression of milestones before initiating KD Diet of which 1 had improvement in milestones on therapy (16.6%); in 4 patients, milestones did not improve norregress (66.6%), was as good as improvement, while in MAD group there were no patients with regression of milestones. 15 patients (23.1%) had normal milestones before starting diet of which, 71.4% improved on KD diet whereas 37.5% had improvement on MAD.
Intelligent quotient was assessed in patients above 6 years of age. However, among >6 years old patients who were given KD (n=4), had IQ between 35 to 50 (moderate/trainable) and among MAD group (n=7), 9.5% patients had IQ 20–35 (severe), 14.2% had 35–50 (moderate/trainable), 9.5% had IQ 50–70 (mild/ educable). There were no patients with profound (IQ<20) and borderline IQ (70–90) in either group. Of these 3 patients on KD group (75%) had improved IQ after treatment of moderate/ trainable group. Whereas 1 each from moderate and mild group on MAD Diet (33.3% and 100% respectively) had improvement in IQ after 6 months. 1 patient from severe IQ group on MAD had same IQ after 6 months. Overall mean IQ of KD group was 47.2 ± 10.8 pre-KD and 53.00 ± 10.37 post-KD. Mean IQ was 47.00 ± 14.41 pre-MAD with mean IQ of 48.00 ± 16.43 post-MAD. Change in IQ pre and post KD was for: 5.80 ± 2.39 and 1.00 ± 2.24 for MAD that was significant (P=0.01), thereby proving efficacy of KD over MAD.
As per one study by Barthold M, et al., where they studied effect of only KD treatment initiation and duration over Glut1 deficiency disorder patients, they found: “KD treatment initiation as well as duration, had a positive effect on the overall IQ score with highest effect on speech motor domain [12]. In our study positive effect was seen in motor and cognitive than speech.
Summary
Comparison of height and weight in both groups at start and end of study
• At start of study mean height and weight was significantly lower among patients who were given Ketogenic Diet (88.28 ± 17.42 cm and 12.42+5.12 kg respectively) comparing to those patients who were given Modified Atkins Diet (107.31 ± 17.66 cm and 17.40 ± 5.52 kg respectively) (p<0.05).
• At 6 months follow up mean height and weight remained significantly lower among patients who were given Ketogenic Diet (92.02 ± 15.56 cm and 13.35 ± 4.08 kg respectively) comparing to those patients who were given Modified Atkins Diet (108.92 ± 16.8 cm and 17.22 ± 6.38 kg respectively) (p<0.05).
While mean height had significantly increased in all patients from start of study to 6 months follow up but mean weight wassignificantly reduced from start of study to 6 months follow up in MAD group but increased in KD group.
Development assessment (<6 years) and intelligent quotient in (>6 years) old patients development
• In this study at the diet initiation, the developmental delay found in 70.5% KD group and 61.1% MAD group patients.
• 13.6% patients had regression of milestones in KD group, no patients in MAD.
• 23.1% had normal milestones.
• Response to therapy
• Delayed milestones: Improvement KD: 78.3% vs. 71.4% to MAD.
• Regressed milestones: Only KD: Improved 16.6%, not regressed: 66.6%.
• Normal milestones: Improved KD: 71.4% vs. 37.5% MAD.
• At start of study mean height and weight was non-significantly lower among patients who were given Ketogenic Diet comparing to those patients who were given MAD.
IQ in >6 years age
• KD (n=4) had IQ between 35 to 50 (moderate/trainable).
• MAD group (n=7), 9.5% patients had IQ 20–35 (severe), 14.2% had 35–50 (moderate/trainable), 9.5% had IQ 50–70 (mild/ educable).
• There were no patients with profound (IQ<20) and borderline IQ (70–90) in either group.
• Response to treatment:
• Mild IQ: KD no patients vs. 100% to MAD.
• Moderate IQ: KD: 75% improved IQ vs. 33.3% to MAD.
• Severe: No patients in KD vs. 0% in MAD.
• No significant difference in mean IQ at pre and post time points between 2 groups.
• Significant difference in mean change of IQ (post-pre) between 2 groups.
Interpretation: KD group had significantly higher gain in IQ values than MAD group.
Conclusion
A RCT conducted in refractory seizure disorder patients attending tertiary health care center of Pune and Mumbai in 65 pediatric refractory seizure patients distributed in two groups and provided KD and MAD.
As regards development and DQ was concerned, children performed better among those who were on KD than MAD. Even there was improvement and gain of milestones who were regressing or there was no regression from the time that KD started that itself is a sort of improvement in DQ. In addition to seizure control parents reported improvement in concentration, alertness and efforts of the child to interact with them, decreased and aggressive behavior, improved quality of sleep. These were used as determinants for assessing the quality of life.
As regards IQ is concerned KD group had significantly higher gain in IQ values post diet than the pre diet as compared to MAD group.
While mean height had significantly increased in all patients from start of study to 6 months follow up but mean weight was significantly reduced from start of study to 6 months follow up in MAD group but increased in KD group. This indicates that growth was proper in either group contrary to the belief that diet hampers growth.
Ketogenic Diets whether Classical or Modified Atkins Diet are effective in treating uncontrolled or refractory epilepsy individually. But Classical Ketogenic Diet outperforms Modified Atkins Diet particularly when growth and developmental milestones are considered.
References
- Mikati MA, Tchapyjnikov D (2020) Seizures in childhood: Nelson textbook of pediatrics. Elsevierp, Amsterdam, Netherlands: 3086
- (2018) Epilepsy. World Health Organization: 1-6.
- Hauser WA, Banerjee PN (2007) Epilepsy: A comprehensive textbook. Wolters Kluwer, Netherlands: 45-47.
- Neal E (2012) Dietary treatment of epilepsy: Practical implementation of ketogenic therapy. (1st edn), John Wiley and Sons, Ltd, Hoboken, USA: 1
- (1982) The King James Version. Bible.
- Wheless JW (2004) ‘Nonpharmacologic treatment of the catastrophic epilepsies of childhood’ Epilepsia 5: 17-22.
[Crossref], [Google Scholar], [Indexed]
- Wheless JW (2012) The Ketognic Diet: Swaiman’s paediatric neurology. (5th edn), Elsevier Saunders Publication, Philadelphia, USA: 836.
- Nation J, Humphrey M, Mackay M, Bonch A (2014) Linear growth of children on a ketogenic diet does the protein-to-energy ratio matter. J Child Neuron 29: 1496-501
[Crossref], [Google Scholar], [Indexed]
- Kossoff EH, Mc Grogan JR, Bluml RM, Pillas DJ, Rubenstein JF, et al. (2006) A Modified Atkins Diet is effective for the treatment of intractable paediatric epilepsy. Epilepsia 47: 421-424
[Crossref], [Google Scholar], [Indexed]
- Mehta R, Goel S, Sharma S, Jain P, Mukherjee SB, et al. (2016) Efficacy and tolerability of the Modified Atkins Diet in young children with refractory epilepsy Indian experience. Ann Indian Accad Neural 19: 523-527
[Crossref], [Google Scholar], [Indexed]
- Ferraria N, Medes P, Otivetra F, Martins C, Fonseca MJ, et al. (2013) Ketogenic diet for refractory epilepsy in children. An institutional experience. Pediat Therapeut 3: 10-13
- Barthold M, Jurkutat A, Goetz R , Schubring L, Spiegler J , et al. (2023) Timing of Ketogenic Dietary Therapy (KDT) introduction and its impact on cognitive profiles in children with Glut1-DS-A preliminary study. Children (Basel) 10: 681.
[Crossref], [Google Scholar], [Indexed]
Open Access Journals
- Aquaculture & Veterinary Science
- Chemistry & Chemical Sciences
- Clinical Sciences
- Engineering
- General Science
- Genetics & Molecular Biology
- Health Care & Nursing
- Immunology & Microbiology
- Materials Science
- Mathematics & Physics
- Medical Sciences
- Neurology & Psychiatry
- Oncology & Cancer Science
- Pharmaceutical Sciences
