Overview Physical Development of Child with Low Birth Weight (Lbw) At Age 5 and Its Influencing Factors-Findings from The Uk Millennium Cohort Study.
Danfu Wu
Danfu Wu*
Department of Childhood & Developmental Disorders, Cambridge University, United Kingdom
*Corresponding author: Danfu W, Department of Childhood & Developmental Disorders, Cambridge University, United Kingdom; Tel No: 07460056363; E-Mail: info@cambridge-imperial.com
Received date: July 24, 2020; Accepted date: August 19, 2021; Published date: August 30, 2021
Citation:Danfu W (2020) Overview Physical Development of Child with Low Birth Weight (Lbw) At Age 5 and Its Influencing Factors-Findings from the Uk Millennium Cohort Study. J Child Dev Disord.Vol:7 No: 8.
Abstract
Many studies have shown that physical development is a primary stage of learning, which is crucial to children’s overall physical and emotional health (Nurse, 2009; Duncombe, 2019; Hilton, 2016). Researcher’s stress that inequalities in physical outcomes will emerge and evolve as children grow older and thus the government and early years practitioners need to pay more attention to social health inequalities (Apouey, 2016). The government responds well to this research by launching a series of child health policies, such as Healthy Start Programme and Healthy Child Programme (HCP) to provide grants, childcare, early education and training that support children’s birth and physical development (Department for Education & Department of Health and Social Care, 2015).
Introduction
Many studies have shown that physical development is a primary stage of learning, which is crucial to children’s overall physical and emotional health (Nurse, 2009; Duncombe, 2019; Hilton, 2016). Researcher’s stress that inequalities in physical outcomes will emerge and evolve as children grow older and thus the government and early years practitioners need to pay more attention to social health inequalities (Apouey, 2016). The government responds well to this research by launching a series of child health policies, such as Healthy Start Programme and Healthy Child Programme (HCP) to provide grants, childcare, early education and training that support children’s birth and physical development (Department for Education & Department of Health and Social Care, 2015).
According to OECD Health Statistics (2018), about 6.9% of all newborns in Britain were born at a low birth weight (LBW) in 2016, generally defined as birth weight < 2500g. However, it remains in the middle of all OECD countries despite a decline in the proportion of LBW babies from 7.5% in 2000 to 6.9% in 2016. There is evidence that LBW has a close association with various health and developmental outcomes in childhood and adulthood (Barker, 1995; McCormick et al., 1990; Moser et al., 2003). To be more exact, LBW is connected with many diseases such as high blood pressure, lung disease, asthma, blindness and poor physical performance (Crowther et al., 2003; Anderson et al., 2003; Marlow et al., 2005; Spittle et al., 2010; Taylor et al., 2006; Croen et al., 2006), which goes against the objective of child health policy to give children a healthy start for life and thus requires early intervention.
This research aims to confirm whether LBW is associated with children’s physical development at the age of 5. Data from the Millennium Cohort Study (MCS) were used for statistical analysis to examine the difference in physical development between children with LBW and their peers with non-LBW. Apart from LBW, other physiological factors and family context mentioned in previous literature were also taken into account that they may influence the outcomes of physical development on average. Therefore, policymakers are likely to develop or perfect early intervention programmes on the basis of mastering the factors related to increased or decreased physical development scores.
Literature Review
Physical development outcomes of children have an irreversible impact on their cognitive and non-cognitive development, school performance and economic productivity in adulthood (Behrman et al., 2002; Gluckman et al., 2007). The literature on child development has emphasized the importance of physical development, especially before the age of 5 when all parts of the body grow rapidly (Frolova, 2018; Rikard, 2010; Lavine, 2004). Also, there exist some identified factors that have negative effects on child development at an early stage and exacerbate inequalities in children’s physical development levels.
Birth weight is a predictor of social and health outcomes in childhood and adulthood (Reichman, 2005; Boardman et al., 2002; Black et al., 2007). Children with low birth weight have prolonged physical development delays than those with normal or high birth weight (Israul & Hera, 2018; Alice et al., 2016). This physical development gap exists because of the failure to supply enough nutrition to the placenta at the especially significant development stage, which may cause subsequent maldevelopments like reduced physical growth and long-term physiological problems.
Mother’s socioeconomic status (SES) is also strongly associated with the inequality in child development, particularly for these preschool children (Reichman, 2005). SES is defined by income, occupation, or education (Dana & Simpson, 1995). Children whose mothers live in poverty, with none education and long term unemployed suffer lower physical development than those who have advantaged mothers. This physical development gap may exist for a number of reasons. One reason may be that rate of LBW increase with decreasing SES of mothers and LBW put the children at a disadvantage for physical development at birth (Dana & Simpson, 1995). Another reason may be that less educated mother are like to be provided with less ability to understand and adopt new methods of child care (Kasarda et al., 1986; Rosenzweig & Schultz, 1983), which have a negative effect on their child’s physical development.
Household income is another factor that cannot be ignored. Children living in a less wealthy poor family are at greater risk for poor physical development and health outcomes than those from a better-off family (Hanushek, 1986; Haveman & Wolfe, 1995; Dearden et al., 2011; Blau,1999; Shea, 2000; Maurin, 2002). Evidence suggests that children from a low-income family may live in a physical environment that offers fewer resources for physical development. Their parents may be less able to afford toys or games beneficial to physical development, to provide high-quality childcare for children, or to live in a safe place for outdoor play (Lawrence, 2009). Furthermore, Shonkoff and Phillips (2000) showed that the quality of parenting children could be greatly affected by poverty. Low-income parents may be more stressed or depressed and thus they may be less responsive to children’s physical development needs (Berger et al., 2009; Yeung et al., 2002; Taylor et al., 2004).
A great deal of literature shows that the rate of LBW increases with the decrease of family socioeconomic status (Hughes & Lisa, 1995; Starfield et al., 1991; Fedrick & Anderson, 1976). According to a major study in the UK, women in lower social classes would be at a 95% higher risk of giving birth to a child with LBW (Fedrick & Anderson, 1976). There may be unique challenges for children from a low-income family and with low birth weight, compared to their low-income peers but with normal or high birth weight, given that low-income children tend to have worse physical development outcomes (Conley & Bennett. 2001; Luize et al., 2017). The relationship between LBW and physical development levels of children will be further investigated in the following analysis.
Previous literature focused on the physical development of children with LBW, which was mainly based on cross-sectional study design and measured the concept of physical development using indicators such as IBM, weight or length/height (Ashlesha & Alison, 2009; Boardman et al., 2002; Paneth, 1995). The perception of child physical development is added to the existing literature by using longitudinal data and the Early Years Foundation Stage (EYFS) as the criterion of physical development. EYFS has set standards that all the early years providers must meet, and it assesses physical development including moving, handing and self-care in addition to basic physical health. The findings of this analysis, thus, enrich the measurement context of physical development and provide a reference value for early education policy.
Data
All the data used in this research were offered by the Millennium Cohort Study (MCS), a longitudinal survey that sampled about 19,000 English newborns in the early 2000s and followed them over time. In addition, a wealth of children’s individual information and family context was available from their parents, allowing researchers to track changes in children’s development from initial baseline conditions. The correlation between children’s physiological characteristics, family backgrounds and long-term physical development was identified by controlling relevant factors.
Children’s physiological characteristics and family backgrounds (independent variables) in this research were mainly gathered from the first sweep of MCS between 2001 and 2002, which was performed when children were 9 months old. The database classified newborns by birth weight as ‘normal’, ‘low’ and ‘high’. In this analysis, infants with ‘normal’ and ‘high’ birth weight were categorised as ‘non-low birth weight’ and others as ‘low birth weight’ (LBW). The outcomes of physical development (PD) were measured by the third sweep of MCS between 2005 to 2006 when children were around 5 years old. PD scores were recorded by class teachers at the end of the first year of school in the Foundation Stage Profile (FSP). FSP was used to assess children in 6 areas of learning and PD was one of the areas (hereafter referred to as ‘FSP-PD’). Noticeably, as the dependent variables, FSP only applied to children in England and so the sample in this study was limited to England.
In this analysis, only families who took part in two sweeps were included, and there were 8,475 children who had valid scores in physical development at MCS 3. Dropping the missing value of the family context independent variables, including family income (75), mother’s highest level of education (5), length of breastfeeding (1,693) and whether mother currently smoked or not (499) brought the sample down to 6,203.
Descriptive Statistics
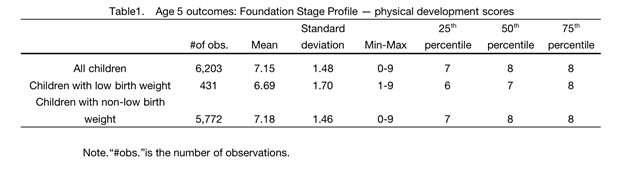
Descriptive statistics on children’s FSP-PD outcomes by low or non-low birth weight are shown in Table 1, which shows mean scores, standard deviation, minimum and maximum scores, and scores of each intermediate quartile (see Appendix 1 for additional descriptive statistics of continuous independent variables and Appendix 2 for descriptive statistics of discrete independent variables).
In this analysis, there were 431 children with LBW whose FSP-PD scores ranged from 0 to 9 with a mean of 6.69 and a standard deviation of 1.70. The other 5,772 children had non-low birth weight, and their FSP-PD scores ranged from 1 to 9 with a mean of 7.18 and a standard deviation of 1.46.
Analysis and Modelling
The purpose of this study is to explore the potential impact of LBW on children’s FSP-PD scores. An ordinary least squares (OLS) regression was established to assess FSP-PD scores based on all independent variables that may be related to the physical health and development of children and students according to previous literature (Glewwe, 1999; Kovsted et al., 2002; Golley et al., 2010; Storey et al., 2011); as such, FSP-PD outcomes maybe also influenced by these variables. Apart from whether the child was of LBW, other independent variables included physiological variables (gender, ethnicity and age at MCS 3) and a set of family characteristics (length of breastfeeding period, family income at MCS 1, whether the mother received education at MCS 1; whether the mother was unemployed at MCS 1 and whether the mother currently smoked or not at MCS 1). FSP-PD scores as dependent variables were continuous.
The assumption that children with LBW have lower FSP-PD scores, even if the impact of other physiological variables and family context factors is controlled, was tested in this study. Moreover, other assumptions at individual and family levels were also tested. At the individual level, higher FSP-PD outcomes are expected to be found with girls and older children based on previous studies (Reichman, 2005; Fedrick & Anderson, 1976; Thomas et al., 1991). At the family level, it is expected to find a positive correlation between breastfeeding time and children’s FSP-PD scores, that is, the longer breastfeeding time, the higher FSP-PD scores. On the other hand, the mother’s lack of education and job as well as the behaviour of smoking are expected to be negatively linked with better FSP-PD outcomes, since these variables put children at a disadvantage for physical development. Household income is expected to be positively associated with better FSP-PD outcomes.
The possible effect of family income on children with LBW was examined using an interaction term in the full model. Children with LBW tend to have lower FSP-PD scores, but there is the possibility for these children who live in a wealthy family rather than a poor family to compensate for birth deficiencies defects by providing them with richer nutrition, more advanced toys or paid training classes to promote their physical development. In this case, a statistically significant interaction coefficient can be observed for low birth weight and household income.
Next, the above-mentioned assumptions will be tested, including the interaction coefficient for low birth weight and family income as well.
Limitations
This analysis should be interpreted in the context of the following limitations. Firstly, FSP-PD scores were measured at MCS 3 when the child was 5 years old. However, as independent variables, family income; the mother’s highest education; whether the mother was unemployed or not; whether the mother currently smoked or not was measured at MCS 1 when the child was nine months old. These independent variables may change from MCS 3 to MCS 1. Secondly, the completion of FSP in England was done by class teachers (MCS Guide to the Datasets, 2014 ), and children were not tested directly. Thus, test scores do not exclude errors caused by measurement errors, which can be supported by Gillborn (2010, p232) who argued that FSP outcomes could be ‘profoundly marked by race/racism’. Thirdly, this model did not capture some of the factors previously mentioned in the literature that may influence FSP-PD scores, such as children’s genetics, duration of physical activities and living environment (Carol Archer; Iram Siraj, 2015; Krame et al., 2012; Conley et al., 2001). Accordingly, how these factors interact with the factor s included in the model is not clear. Last but not least, causality cannot be inferred in any observational study, according to previous literature (Anderson, 2017).
Results
In this analysis, a complete, unlimited model was used to explore the potential relationship between LBW and children’s FSP-PD outcomes at age of 5, controlling for children’s gender; ethnicity; age; mother’s highest level of education and occupation; household income; length of breastfeeding period and whether mother currently smoked or not.
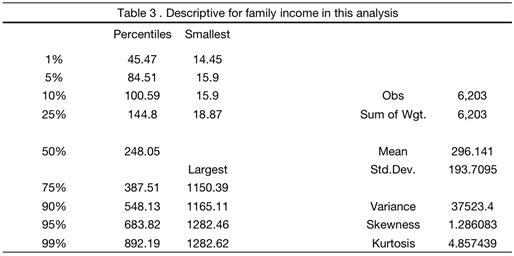
Consistent with the hypotheses, there is a statistical significance in the relationship between children with LBW and FSD-PD scores at the 0.1% (p<0.001) level when controlling the household income and mother’s SES that (as detailed above) are the most possible confusion. Children with LBW are given about 0.51 points lower than their peers with non-low birth weight on average (recall from Table 1 that the range of FSD-PD scores are from 0 to 9). Table 2 shows that the relationship between family income and FSD-PD scores is also statistically significant at the 0.1% (p<0.001) level and children are given 0.0008 points higher for every incremental increase of family income on average. Table 3 shows the gap in family income in this analysis. Combining the results in Table 2 and Table 3, we find that children with family income at the 25th percentile are given about 0.19 points (242.71*0.0008) lower than their peers with household income at the 75th percentile score and about 0.60 points (747.39*0.0008) lower than children in the richest family at the 99th percentile. Given the range of FSD-PD scores from 0 to 9, there is a considerable gap between the poorest and richest children.
Contrary to the expectation, there is no statistically significant interaction between low birth weight and family income on FSD-PD scores, indicating that children with LBW may not be significantly affected by various levels of family income.
At the individual level, the better physical development outcomes of girls and older children can prove the hypotheses. Additionally, lower FSD-PD scores (0.3 points) were given to Pakistani and Bangladeshi children than their white peers on average.
All the family context factors in this analysis are statistically significant with FSD-PD scores, which is consistent with the hypotheses. Children whose mothers have received education (0.14 points), are employed (0.25 points) and do not smoke currently (0.13 points) have higher FSD-PD scores. Additionally, longer breastfeeding time is positively related to higher FSD-PD scores (0.03 points).
The full model accounts for 10% of the variance in FSD-PD scores observed, as indicated by R-square, the goodness-of-fit measure.
| Table 2: OLS regression of FSP-PD scores on physiological and family factors | |
|---|---|
| IndependentÃÂ variables | -1 |
| Full OLS Model | |
| Sex (girls=1) | 0.41408*** |
| -0.03582 | |
| Age in months | 0.08332*** |
| -0.00622 | |
| Ethnicity | |
| Indian | 0.03922 |
| -0.10327 | |
| Pakistani&Bangladeshi | -0.30382*** |
| -0.07212 | |
| Black | -0.16692 |
| -0.09745 | |
| Mixed/Other | 0.00427 |
| -0.08116 | |
| Low birth weight (LBW) | -0.51481*** |
| -0.12208 | |
| Length of breastfeeding | 0.03000*** |
| -0.00831 | |
| Table 2 (continued) | |
| IndependentÃÂ variables | -1 |
| Full OLS Model | |
| Mother long term unemployed | -0.13848** |
| -0.04076 | |
| Uneducated mother | -0.25415*** |
| -0.05465 | |
| Mother currently smokes | -0.12740* |
| -0.04304 | |
| Family income | 0.00082*** |
| Low birth weight (LBW)Ã? Family income | 0.00035 |
| -0.00036 | |
| Constant | 1.69180*** |
| -0.3891 | |
| Observations | 6,203 |
| R-squared | 0.1 |
| Standard errors in parentheses | |
| *** p<0.001,ÃÂ ** p<0.01, * p<0.05, + p<0.1 |
Discussion and Conclusion
In this analysis, OLS regression was used to model the physical development of children with LBW. LBW is associated with lower physical development scores in accordance with previous studies (Ashlesha & Alison, 2009; Boardman et al., 2002; Paneth, 1995). This holds true even after a wide range of potential confounding characteristics is controlled. The findings support the intervention aimed at reducing the risk of giving birth to newborns with LBW, such as the Healthy Start programme. This programme aims to help pregnant women, especially those low-income mothers, have enough nutrition to ensure the health of their babies (Department for Education, Department of Health and Social Care, 2015). However, apart from the lack of adequate nutrition, family background, infection and other factors may also cause low birth weight (Babycentre Medical Advisory Board, 2017). Thus, later intervention in the physical development of low birth weight children is particularly important. Physical ability is one of the areas that Special Education Needs (SEN) should support (Department for Education, 2014). Accordingly, these low birth weight children need to be individually identified at the time of birth registration, and child health visitors should carry out health examination to track the physical development of these children with low birth weight. Once children are found to be physically less developed than their peers, they can be supported by education, health and care (EHC) plan as soon as possible.
UK government’s concern is growing about the influence of mothers on the physical development of their children. Start4Life programme is one of the examples to advise parents on how to encourage a healthy diet and physical activities among young children. The results show that mothers at lower socioeconomic status (employed and educated or not) and of bad health habits (smoke) have a negative impact on children’s physical development and that longer breastfeeding time is beneficial to FSD-PD scores. Start4Life programme, therefore, is conducive to children’s physical development, especially those whose mothers have never received an education, because less educated mothers may be less able to understand or adopt new childcare approaches (Kasarda et al., 1986; Rosenzweig & Schultz, 1983). Additionally, the government recommends that infants should be exclusively breastfed (Department of Health, 2013), and the NHS’s stop smoking service (NHS SSS) is beneficial to children’s physical development, which needs to continue.
Previous literature has highlighted that lower family income puts children at a disadvantage in physical development when controlling other related factors, as this study comes to the same conclusion. Children from low-income families in the UK have poorer diets (Church, 2007) and higher levels of ill health, including the higher-than-average prevalence of obesity (Craig and Mindell, 2013). The findings support the universal instant free school meal policy (UIFSM) that has been in place since 2014. Many studies have shown that school meals play a role in the development of eating habits and are of super nutritional quality (Kitchen et al., 2016; Golley et al., 2010; Nelson et al., 2015). UIFSM can be seen as an intervention for health inequalities (Marmot Review, 2010), which is beneficial to children’s physical development and needs to continue.
| Continuous independent variables | #of obs. | Mean | Standard deviation | Min-Max | 25th | 50th percentile | 75th percentile |
|---|---|---|---|---|---|---|---|
| percentile | |||||||
| Age in months at | 6,203 | 61.81 | 2.88 | 55-72 | 60 | 62 | 64 |
| MCS 3 | |||||||
| Family income in | 6,203 | 296.14 | 193.71 | 14.45-1282.62 | 144.8 | 248.05 | 387.51 |
| ÃÂ MCS 1 | |||||||
| Length of breastfeeding period in months | 6,203 | 2.15 | 2.32 | 0-7 | 0 | 1 | 4 |
Appendix 1
Table 3: Descriptive for continuous independent variables in full model
| Discrete Independent variables | #of obs. | % | |
|---|---|---|---|
| ChildÃÂ Characteristics | |||
| Child gender | female | 3,043ã?? | 49.06ã?? |
| male | 3,160 | 50.94 | |
| Ethnicity | |||
| White | 4.939 | 79.62 | |
| Indian | 198 | 3.19 | |
| Pakistani&Bangladeshi | 507 | 8.17 | |
| Black | 232 | 3.74 | |
| Mixed/Other | 327 | 5.27 | |
| FamilyÃÂ Context | |||
| Mother’s socioeconomic statusï¼?SES) | Mother with no-education | ||
| Yes | 950 | 15.32 | |
| No | 5,253 | 84.68 | |
| Mother unemployed | |||
| Yes | 3,239 | 52.22 | |
| No | 2.964 | 47.78 | |
| Mother’s behaviour | Mother currently smokes | ||
| Yes | 1,776 | 28.63 | |
| No | 4,427 | 71.37 |
Table 4: Descriptive for discrete independent variables in full model
References
- Anderson, S E, Sacker, A, Whitaker, R C, Kelly, Y (2017), Self-regulation and household routines at age three and obesity at age eleven: longitudinal analysis of the UK Millennium Cohort Study, International Journal of Obesity, 41 (10), 1459-1466.
- Apouey, B.H. (2016), Child physical development in the UK: the imprint of time and socioeconomic status, Public Health, 141, 255-263.
- Araujo, L., Mélo, T., & Israel, V. (2017). Low birth weight, family income and paternal absence as risk factors in neuropsychomotor development. Journal Of Human Growth And Development, 27(3), 272-280.
- Barker, D. J. (1995), Fetal origins of coronary heart disease. British Medical Journal, 311, 171â??174.
- Behrman, Jr & Rosenzweig, Mr (2002), Does increasing women's schooling raise the schooling of the next generation? American Economic Review, 92(1), 323-334.
- Black SE, Devereux PJ & Salvanes KG (2007), From the cradle to the labor market? The effect of birth weight on adult outcomes, Q J Econ, 122(1), 409â??439.
- Boardman JD, Powers DA, Padilla YC & Hummer RA (2002), Low birth weight, social factors, and developmental outcomes among children in the United States, Demography, 39(2), 353â??368.
- Brooks, A. M., Byrd, R. S., Weitzman, M., Auinger, P., & McBride, J. T. (2001). Impact of low birth weight on early childhood asthma in the United States. Archives of Pediatrics and Adolescent Medicine, 155(3), 401â??406
- Carol Archer & Iram Siraj (2015), Encouraging physical development through movement-play, London : SAGE.
- Conley, D., & Bennett, N. G. (2001). Birth weight and income: Interactions across generations. Journal of Health and Social Behavior, 42(4), 450-465.
- Conley, Dalton and Bennett, Neil G(2001), Birth Weight and Income: Interactions across Generations, Journal of Health and Social Behavior, 42(4), 450-465.
- Craig, R. and Mindell, J. (2013), â??Health survey for England 2012: health, social care and lifestylesâ?Â, available at: www.hscic.gov.uk/catalogue/PUB13218 (accessed 1st January 2020).
- Datar, A. & Jacknowitz, A. (2009), Birth Weight Effects on Childrenâ??s Mental, Motor, and Physical Development: Evidence from Twins Data, Maternal and Child Health Journal, 13, 780â??794.
- Duncan T., John S. & Maria-Helena H. (Spring, 1991), How Does Mother's Education Affect Child Height. The Journal of Human Resources, 26(2), 183-211.
- Duncombe, R. (2019). The Physical Development Needs of Young Children. Routledge.
- Fedrick, J.& Anderson, A.B.M. (1976), Factors associated with spontaneous preterm birth. British Journal of Obstetrics and Gynaecology, 83, 342
- Gillborn, D.(2010), Reform, racism and the centrality of whiteness: assessment, ability and the â??new eugenicsâ??, Irish Educational Studies, 29(3), 231-252.
- Gluckman, PD; Hanson, MA and Beedle, As (2007), Early life events and their consequences for later disease: A life history and evolutionary perspective, American Journal of Human Biology, 19(1), 1-19.
- Goisis, A., �zcan, B. & Myrskylä, M. (2017), Decline in the negative association between low birth weight and cognitive ability, Proceedings of the National Academy of Sciences of the United States of America,114 (1), 84-88.
- Golley R, Baines E & Bassett P (2010), School lunch and learning behaviour in primary schools: an intervention study. Eur J Clin Nutr, 64, 1280â??1288.
- Graham H.& Anna V.(2010), Is children's free school meal 'eligibility' a good proxy for family income, British Educational Research Journal, 36(4), 673-690.
- Hack, M., Taylor, H. G., Drotar, D., Schluchter, M., Cartar, L., Andreias, L., et al. (2005). Chronic conditions, functional limitations, and special health care needs of school-aged children born with extremely low-birth-weight in the 1990s. Journal of the American Medical Association, 294, 318â??325.
- Hasanah, I.â??& Susanti, H.(2018), Does water and sanitation effects on childrenâ??s physical development? Evidence from Indonesia Family life Survey (IFLS) 2014, E3S Web of Conferences, 74, 1-6.
- Hilton, C (2016), An exploration of the cognitive,â??physicalâ??and psychosocialâ??developmentâ??of children with Apert syndrome, International Journal of Disability, Development and Education , 64 (2) 198-210.
- Hughes D. & Simpson L. (1995), The Role of Social Change in Preventing Low Birth Weight, The Future of Children 5, 5(1), 87â??102.
- James C. (1995),Racial and Ethnic Differences in Birthweight: The Role of Income and Financial Assistance, Demography, 32(2), 231â??247.
- Jenny W., Pinki S., Jo P. & Rosie M. (2015), Interventions to increase free school meal take-up, Health Education, 115(2), 197-213.
- Kitchen S, Tanner E, Brown V et al. Evaluation of the Free School Meals Pilot: Impact Report 2013 .http:// www.schoolfoodplan.com/plan/ (accessed 31st December, 2019).
- Kramer, M., Waller, L., Dunlop, A., & Hogue, C. (2012). Housing Transitions and Low Birth Weight Among Low-Income Women: Longitudinal Study of the Perinatal Consequences of Changing Public Housing Policy. American Journal Of Public Health, 102(12), 2255-2261.
- Lee, H., & Barratt, M. (1993), Cognitive development of preterm low birth weight children at 5 to 8 years olds. Developmental Behavioral Pediatrics, 14, 242â??248.
- Lisa K. B., Gina A. C. & Vicki Simonsmeier Shawnee M. H.(2014), Academic outcomes of very low birth weight infants: The influence of mother-child relationships, Infant Mental Health, 36(2), 156-166.
- Martorell, R., Horta, B., Adair, L., Stein, A., Richter, L., & Fall, C. et al. (2009). Weight Gain in the First Two Years of Life Is an Important Predictor of Schooling Outcomes in Pooled Analyses from Five Birth Cohorts from Low- and Middle-Income Countries. The Journal Of Nutrition, 140(2), 348-354.
- McCormick, M. C. (1985). The contribution of low birth weight to infant mortality and childhood morbidity. The New England Journal of Medicine, 312, 82â??90.
- McCormick, M. C., Gortmaker, S. L., & Sobol, A. M. (1990). Very low birth weight children: Behavior problems and school difficulty in a national sample. The Journal of Pediatrics, 117, 687â??693.
- Moser K, Li L., Power, C. (2003), Social inequalities in low birth weight in England and Wales: trends and implications for future population health, J Epidemiol Community Health, 57, 687â??691.
- Nelson M, Gibson K & Nicholas J (2015), School lunch take up and attainment in primary and secondary schools in England. Front Public Health, 3, 230.
- Nurse, A. (2009). Physical development in the early years foundation stage. Routledge.
- Paneth, N. S. (1995). The problem of low birth weight. The Future of Children, 5(1), 19â??34.
- Reichman, N.E. (2005), Low birth weight and school readiness, Future Child, 15(1), 91â??116.
- Seith, E. (2012): Free school meal failures dished up by TESS survey, The Times Educational Supplement Scotland, 2274, 1-3.
- Starfield, B ; Shapiro, S ; Weiss, J ; Liang, K Y ; Ra, K ; Paige, D & Wang, X B (1991), Race, family income, and low birth weight, American journal of epidemiology, 134(10), 1167-1174.
- Wolfe, B.L. & Behrman, J. R. (1987), Women's schooling and children's health: Are the effects robust with adult sibling control for theâ??women'sâ??childhood background, Journal of Health Economics, 6(3), 239-254.
- Wu, Y. W., Croen, L. A., Shah, S. J., Newman, T. B., & Najjar, D. V. (2006). Cerebral palsy in a term population: Risk factors and neuroimaging findings. Pediatrics, 118, 690â??697.
- Yngve, Agneta (2007), We must not fail the children of Africa, Public Health Nutrition, 10(4), 323-324.
Open Access Journals
- Aquaculture & Veterinary Science
- Chemistry & Chemical Sciences
- Clinical Sciences
- Engineering
- General Science
- Genetics & Molecular Biology
- Health Care & Nursing
- Immunology & Microbiology
- Materials Science
- Mathematics & Physics
- Medical Sciences
- Neurology & Psychiatry
- Oncology & Cancer Science
- Pharmaceutical Sciences